

“It’s déjà vu all over again.”
— Yogi Berra
The first six months of 2024 were equally as kind to investors as the first six months of 2023. And that’s saying something, knowing that calendar-year total return in 2023 for the full year exceeded 26%.1 Returns for the S&P 500 in both six-month periods at the start of these two years were robust and approached the 15% level for each.2 One of Yogi Berra’s most popular Yogi-isms, a quote of his cited above that he uttered after he watched Mickey Mantle and Roger Maris hit back-to-back homers during a game in that record-setting 1961 home-run season for Maris, seems appropriate to describe the stock market as we witnessed a repeat of last year’s first-half gains again in 2024’s first half. Indeed, it is déjà vu all over again.
In keeping with this theme, just like last year, the S&P 500 has hit our 2024 calendar year-end projected price target well in advance of our expectations. Specifically, our 2024 year-end optimistic price target of 5,400 for the S&P 500 is now actually slightly below the current index level of 5,460 as of June 303; last year, our base case target of 4,500 for calendar year-end 2023 also was achieved slightly after the midyear break in early July 2023.
Earnings Forecast Extended to 12 Months
Like last year, we are not raising our calendar year-end target. We believe an assumed price-to-earnings (P/E) ratio of 21 applied to consensus 2025 earnings in the midst of the current interest rate and inflation environment (the assumptions underlying our 5,400 year-end target) is rational and realistic. We see no reason from a fundamental standpoint to raise our forecast. If investors want to become super-giddy should the Federal Reserve begin to cut interest rates soon and drive a market melt-up by lifting the P/E substantially from here, so be it.
The Mariner Equity Team is inspired by the opportunity to add value via active stock selection in our various strategies, recognizing lower correlations among individual stocks this year and disparate valuation levels with the equal-weighted S&P 500 trading at 16 times forward earnings, well below the overall index P/E of more than 21 times and the so-called Magnificent 7’s of over 33 times. 4 Further, we believe it is overly nuanced and foolish to attempt to make short-term, six-month predictions on market direction. Rather, we focus on simply getting the intermediate- and longer-term 12- to 15-month price trends in the market correct (in addition to executing solid stock selection in our individual strategies).
Therefore, instead of raising or adjusting our 2024 calendar year-end price target that will be upon us in less than six months, we are diligently updating our forecast by extending the horizon period to mid-2025 and introducing a new price target over that longer 12-month period ending June 30, 2025. We believe this is a much more productive exercise. We do expect new highs in the S&P 500 by July of next year and anticipate positive trend over that time frame.
This practice of completing a midyear review in July on the heels of the Crystal Ball Outlook that we present to our clients in January has become an annual tradition. In July of every year, we update our outlook by rolling it out to encompass a next 12-month view. This is consistent with our investment process and philosophy … and exactly how we managed this last year.
FVTs Support “Hold Your Ground” Message
There are some other major déjà vu items to note about this year’s solid advance so far compared to last year, as well as about the catalysts that inspired the nice advance.
The similarity in catalysts for the advances during both years’ first halves center on the solid fundamental and valuation backdrop and favorable technical price trends (we refer to these metrics as the FVTs). These really have not changed much in tenor, and their healthy status is common to both periods. The mosaic may have improved a bit in 2024 versus 2023, with a trade-off in that economic growth is slowing a tad this year, yet intermediate interest rates have stabilized, the inflation picture is drastically improved from last year and the Fed is in a far better position from a policy standpoint.
The key point, though, is that the FVTs overall have remained solid in both 2023 and 2024. This fact is what has given us the confidence and conviction to maintain our positive “hold your ground” message and recommend that clients maintain their long-term strategic allocation to equities both this year and last. The difference is that last year this was a lonely, contrarian message, while this year many peers have come around to adopt our more constructive view as the data has continued to trend in a favorable direction.
Fundamental Data Remains Healthy
In terms of the healthy fundamental data, employment levels and job growth have remained solid throughout, and real wages and income continue to improve/rise as inflation calms. This has helped to support consistently strong consumer spending, particularly on “experiences”; i.e., dining out, travel, etc. Labor productivity has reaccelerated, which allows companies to pay higher wages without straining margins and profits. We’ve seen a renaissance in capital spending, and it has been surprisingly resilient as companies reshore on the heels of lessons learned from massive supply constraints that surfaced during the pandemic.
This is all part of the “Breaking News: It’s OK” story to the market these past two years, despite the wild swings in headlines and emotions. Maybe this message doesn’t sell newspapers, but this measured view is grounded in the data.
An Inflection in Transitional Headwinds
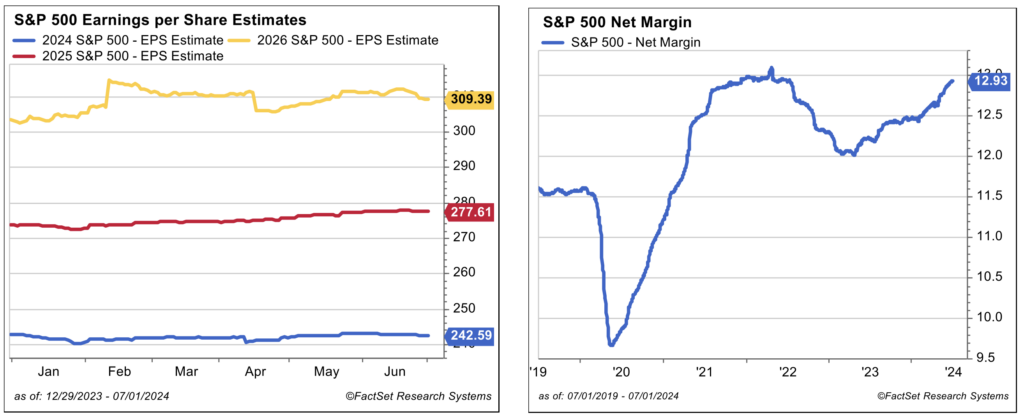
The difficult transitions occurring in the 2022 period, which were headwinds and spurred fears about potential recession and stagflation in 2023, have shifted to feeling tailwind-like in 2023/2024. These positive transitional forces are part of our continued constructive thesis. To wit, real gross domestic product growth did not implode in 2023 as feared but has continued to expand. Earnings not only did not collapse as the bearish camp prognosticated in 2023, but earnings expectations and margins are also rising for both 2024 and 2025 with anticipated earnings growth of 10% this year and over 14% next.
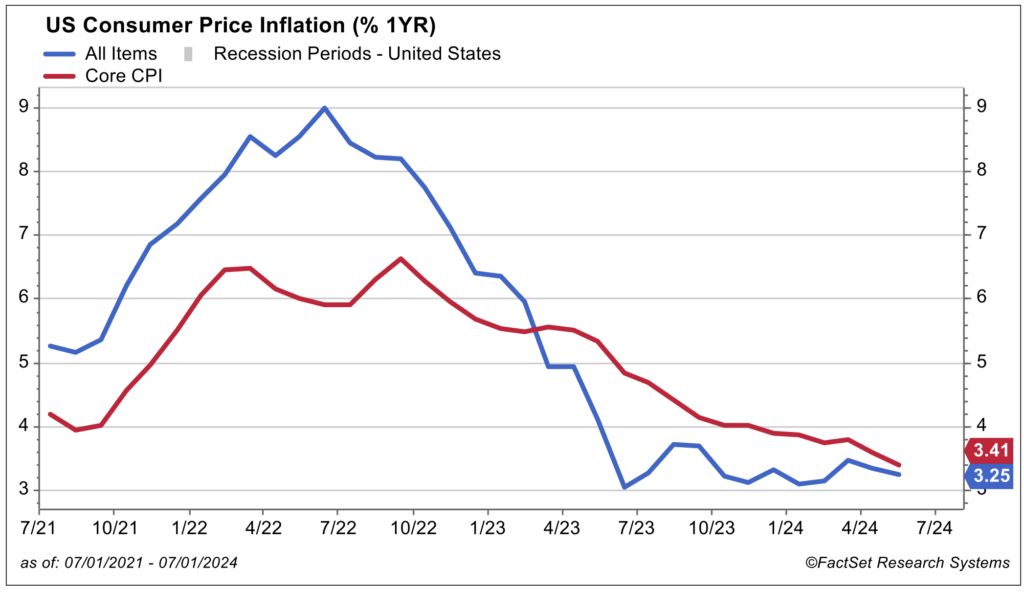
Inflation peaked in mid-2022, although many experts have been slow to recognize this, and has consistently declined since then such that it is pacing to meet the Fed’s 2.5% forecast at year-end … well below the 9.1% headline peak back in June 2022. Further, inflation is on the decline globally with the U.S. Fed as well as other central banks throughout the world poised to begin easing. Several already have.
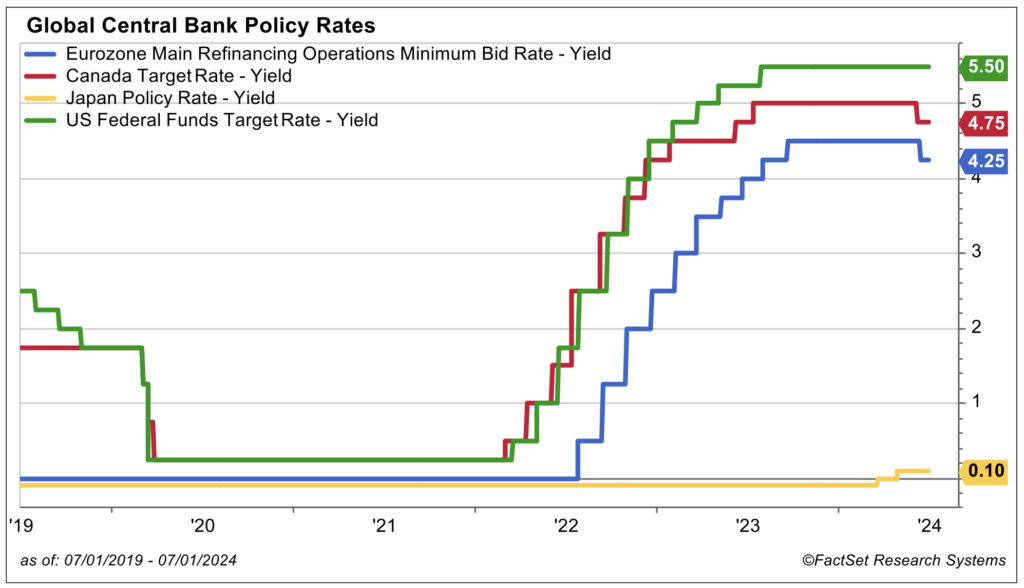
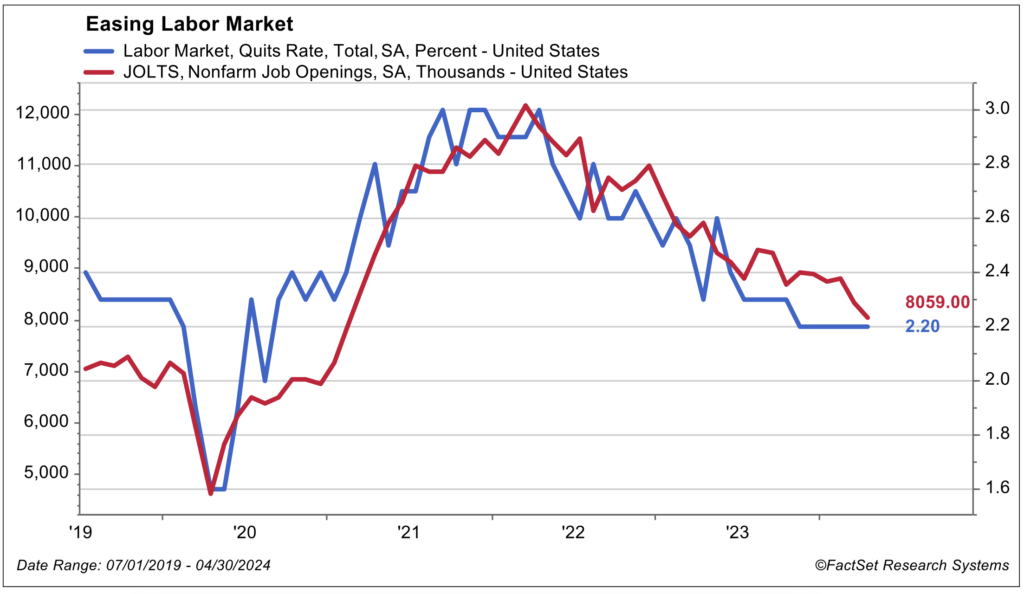
Bottom line, transitional-related fears have shifted from worry about rising supply constraints and inflation, restrictive central bank policy and excessive tightness in the labor force just two years ago to broader acceptance today (by investors other than just us) that transitional forces are now positive in nature. Specifically, it is increasingly recognized that supply constraints have declined significantly, inflation is falling, central banks are studying the right moment to ease and there are multiple signs that the former tight labor market conditions are easing up.
Yes, it is true that aggregate price levels are roughly 20% higher than the pre-pandemic period, which still irritates and stirs frustration, but it is important to note that wages and nominal income are also roughly 20% higher. Importantly, real income to consumers is equal or better.5
A Little Crystal Ball History
We were gratified that we were one of only a few firms with a positive message last year with our theme of “2023 is likely to be the inverse of 2022.” Indeed, it was. In terms of the rest of the 2023 story, we know that the market went on to enjoy a historic Santa Claus rally in last year’s final two months that pushed the S&P 500 up to just below the 4,800 level (our optimistic case price target for 2023) by the December 31, 2023, close, which made for a stellar finish and stellar year.
In our midyear review last July, we did not update/raise our calendar year 2023 price target range of 4,500 to 4,800 for the S&P 500. Instead, we introduced a new base case price target of 5,000 over the next 12 months or for the 12-month period ending July of 2024. Subsequently, in January of this year we established a 2024 calendar-year target of up to 5,400 for the S&P 500 and rolled out our “back to normal” theme, explaining our expectations for more normal levels for all metrics this year ranging from interest rates to inflation to growth.
At this juncture, we are introducing a new S&P 500 price target of 6,000 by July 2025. Unlike last year when we were out of consensus in our positive view, our outlook at present places us in the middle of the pack in terms of our thinking and targets. Several well-known strategists are scrambling to raise price targets for year-end 2024 versus our more measured approach in which we maintain our previously established year-end expectations but extend our outlook horizon and introduce our forecast of moderate but healthy gains over the next 12 months.
The Nitty Gritty: Base Case – S&P 500 at 6,000 by Second Half of 2025
The table below outlines various scenarios in our upcoming midyear review and Crystal Ball update that we will present on July 25. Our base case of 6,000 in the next 12 months is predicated on the following assumptions:
- GDP growth of 1.5% to 2.0%
- Double-digit rates of earnings growth and consensus 2026 S&P 500 earnings of $300
- P/E on forward earnings of 20 times
- Stable intermediate-term interest rates at close to current levels
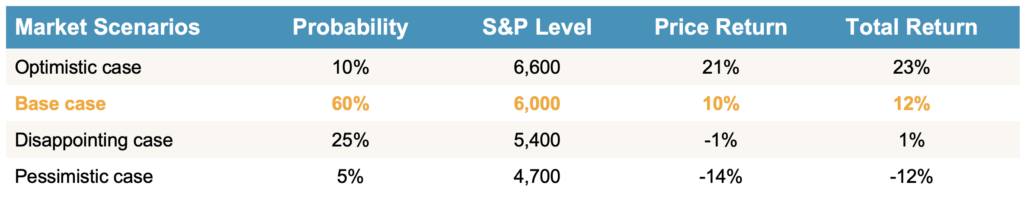
Optimistic Case: Based on P/E of 22.5x on a blended consensus 2024 & 2025 earnings of $293.
Base Case: Based on P/E of 20.5x on a blended consensus 2024 & 2025 earnings of $293.
Disappointing Case: Based on P/E of -18.5x on a blended consensus 2024 & 2025 earnings of $293.
Pessimistic Case: Based on a lower 16.5x P/E on a disappointing blended 2024/2025 earnings estimate of $285, down from current consensus estimate of $293.
IMPORTANT: The target return expectations regarding the likelihood of various investment outcomes are hypothetical in nature, do not reflect actual investment results, and are not guarantees of future results.
These price target expectations are for the next 12 months through June 2025. For all the scenarios outlined above, the price return is determined using a starting level of 5460, the closing price for the S&P 500 on June 28, 2024, and the total return is incorporating the impact of dividends; we are using a flat 2% expected dividend, and the actual dividend yield will vary. Consensus earnings projections based on information obtained from FactSet. The environment set forth above is an estimate based upon research and formulation of estimates. There is no guarantee that any claims made will come to pass. Individuals cannot invest directly in an index.
Index returns do not include the impact of trading costs or advisory and other fees. Scenarios are subject to change at the firm’s discretion with no notice to you.
We cover various alternative scenarios that could play out, but the table above illustrates our conviction in future market gains via our 70% assigned probability of double-digit gains over the coming year.
Wrap-Up
There are, no doubt, wall of worry items not covered in this issue. They include concerns about Fed policy, worry about narrow leadership and more concentrated returns in the market as well as fears surrounding the impact of the upcoming presidential election. We will cover each of these in our upcoming midyear review. Suffice it to say that we believe the Fed is in a good position now, the market is broader than advertised and elections drive volatility but not market returns … the FVTs do that. And if you think this election is venomous and polarizing, please read history about the early 1900s, the 1950s, the 1960s, etc. It will put some of those fears in perspective. Please tune in to our July 25 updated Crystal Ball presentation when we address all the issues. Breaking news: It’s all OK in terms of the current data, in our view.
Sources:
1-4FactSet
5FactSet CPI from Bureau of Labor Statistics, Personal Income from Bureau of Economic Analysis
This commentary is provided for informational and educational purposes only. It is not intended to be personalized advice or a recommendation to buy or sell any security or engage in a particular investment or other strategy. Nothing herein should be relied upon as such, and there is no guarantee that any claims made will come to pass. Actual results or developments may differ materially from those projected. The information is deemed reliable, but we do not guarantee accuracy, timeliness, or completeness. It is provided “as is” without any express or implied warranties. Any opinions expressed are subject to change without notice and are not intended as investment advice or to predict future performance.
Investing involves risk and the potential to lose principal. Past performance does not guarantee future results. Please consult your financial professional before making any investment or financial decisions.
The indexes referenced herein are unmanaged and cannot be directly invested in. The S&P 500 Index is a market-cap weighted stock index constructed to track the share price performance of the top 500 large-cap U.S. equities.
MIAN and MPS do not provide legal or tax advice.